Operating Cost Synergies
Acquirers pay premiums by consolidating overhead, redundant software, and corporate divisions, directly increasing profit margins.
Estimate post-merger integration cost savings and cross-sell premiums. Calculate capitalized synergy value using transaction metrics to command maximum exit valuation premiums.
Model post-merger integration cost savings and cross-sell premiums
Estimated 5x capitalized value of annual synergy.
Strategic buyers share 30% - 50% of the capitalized synergies in the acquisition premium to win competitive bid processes.
Get an instant AI-powered strategic review of the buyer synergy potential and bidding premium.
Acquirers pay premiums by consolidating overhead, redundant software, and corporate divisions, directly increasing profit margins.
Selling products to the acquirer's client base drives post-acquisition revenue growth, justifying strategic premiums.
Estimating cost and revenue synergies defines the maximum offer cap strategic buyers can pay while maintaining positive returns.
In corporate finance, merger synergiesrefer to the incremental financial benefits achieved when two businesses combine. The core premise is that the combined entity will generate higher profits or lower costs than the sum of the two standalone companies (“1 + 1 = 3”).
When strategic acquirers evaluate targets, they build detailed synergy models to justify paying an acquisition premiumover the seller's standalone market valuation. Sellers who understand how to quantify these gains can negotiate from a position of strength.
Deal makers separate integration advantages into two distinct categories:
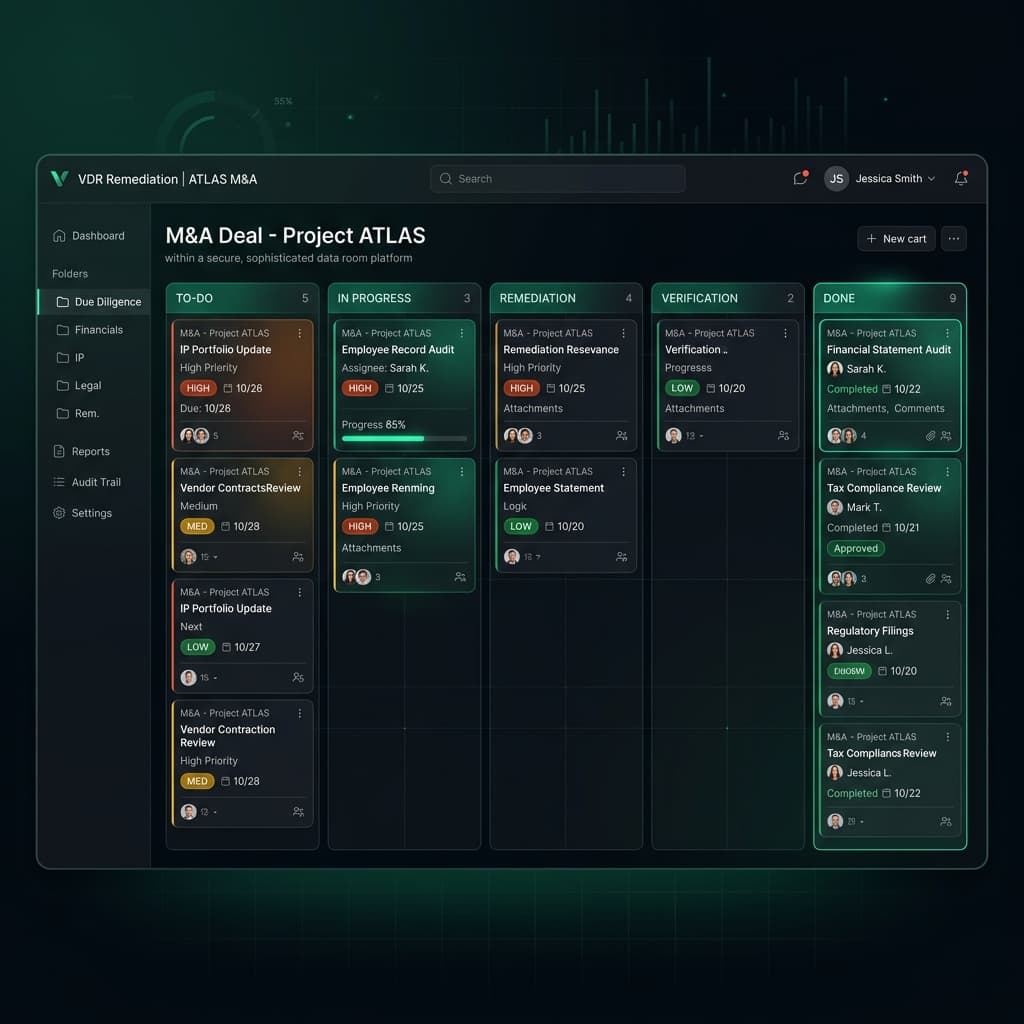
AIVI empowers boutique M&A firms and investment banks to generate CIMs, conduct instant VDR gap checks, and manage exit readiness automatically from a unified data model.
Strategic buyers naturally want to keep 100% of integration savings for themselves. However, in competitive M&A auction processes, prepared sellers defend premium multiples by presenting quantified synergy models in their Confidential Information Memorandum (CIM).
By capitalizing annual synergies (e.g. at a conservative 5x multiplier), you define the total transaction value unlocked. In final negotiations, sellers can expect to capture 30% to 50% of this capitalized synergy value, added directly to their purchase price.
Consider a seller with $2M EBITDA being acquired by a $10M corporate buyer. If the transaction cuts overlapping administrative costs by $300k and unlocks $200k in annual cross-sell profits, the total annual synergies are $500k. Capitalized at a 6x industry multiple, the transaction unlocks $3.0M in synergy value. Sharing 40% of this value commands a **$1.2M acquisition premium** for the seller.
Quantify Enterprise Values, verify due diligence books, and estimate strategic synergy premiums in real-time.
Model Enterprise Value and EBITDA multiples based on cash-flow parameters.
Reconcile VDR files and CIM statements to check QofE due diligence clawbacks.
Verify exit-readiness parameters, customer concentrations, and legal roadblocks.
Estimate annual cost reductions and customer cross-sell synergy values.
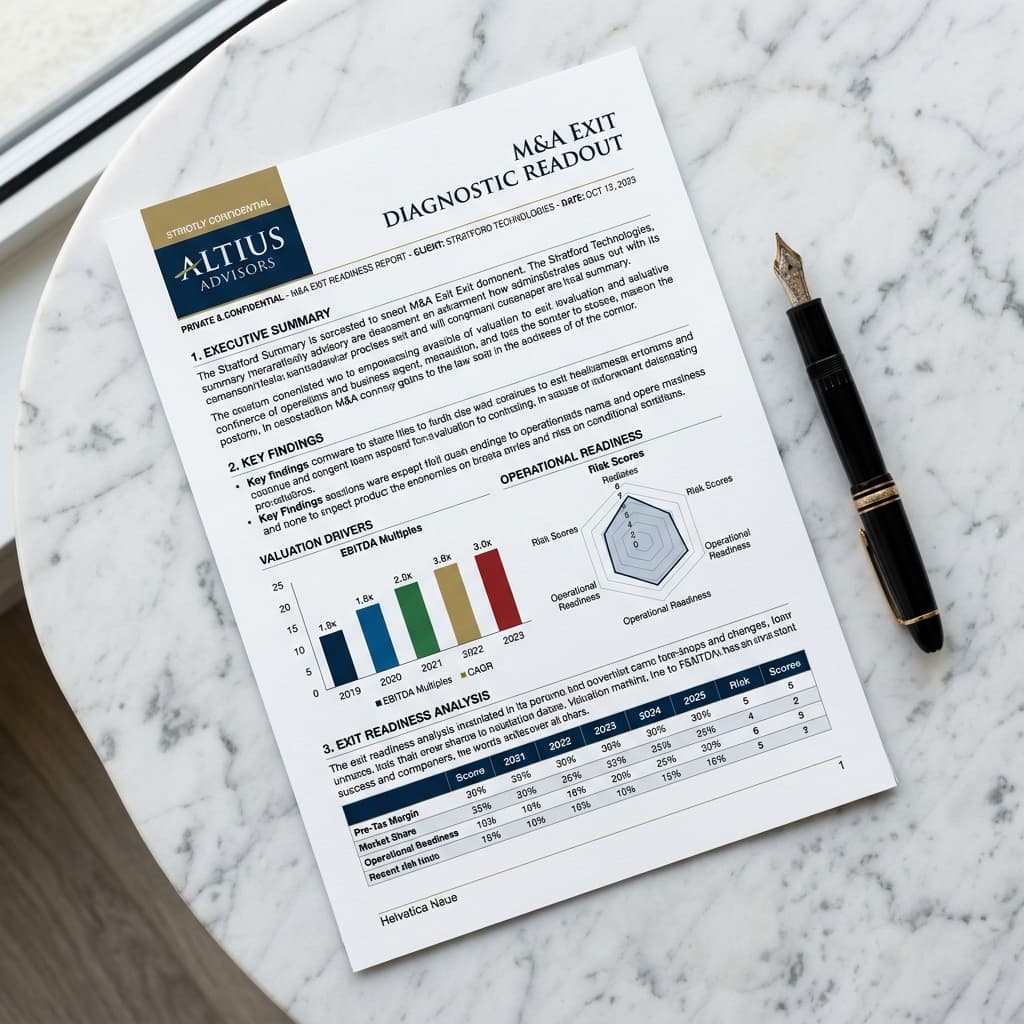
Leverage branded diagnostic assessments, AI drafting tools, and shared client collaboration channels.

Turn exit diagnostics into structured Confidential Information Memorandums automatically.

Mapstrategic buyer synergies and justify exit premium values across 6 dimensions.
Convert diagnostic risk findings into white-labeled seller remediation workflows.

Guide draft output tone with your boutique firm's custom brand vocabulary rules.
Read advanced articles written by tech corporate advisors covering escrow, EBITDA multiples, and transaction logs.
 M&A Diligence
Step-by-step best practices to structure folders, manage user permissions, and ensure secure buyer access.
 Valuation
A practical breakdown of valuation approaches owners and advisors use before a sale process.
 Deal Structuring
How AI-assisted CIM workflows reduce drafting time while keeping deal materials consistent.