Debt Capacity Metrics
Private equity sponsors leverage cash flows by funding acquisitions with 3x to 5x EBITDA in senior and mezzanine loans.
Estimate your acquisition debt capacity. Compare Senior and Mezzanine debt tranches, model debt repayment schedules, and calculate sponsor equity IRR outcomes.
Model Leveraged Buyouts & Sponsor Equity Returns
Private equity deals target 3x to 5x leverage ratios. Exceeding 6x leverage leads to cash constraint audits during down-cycles.
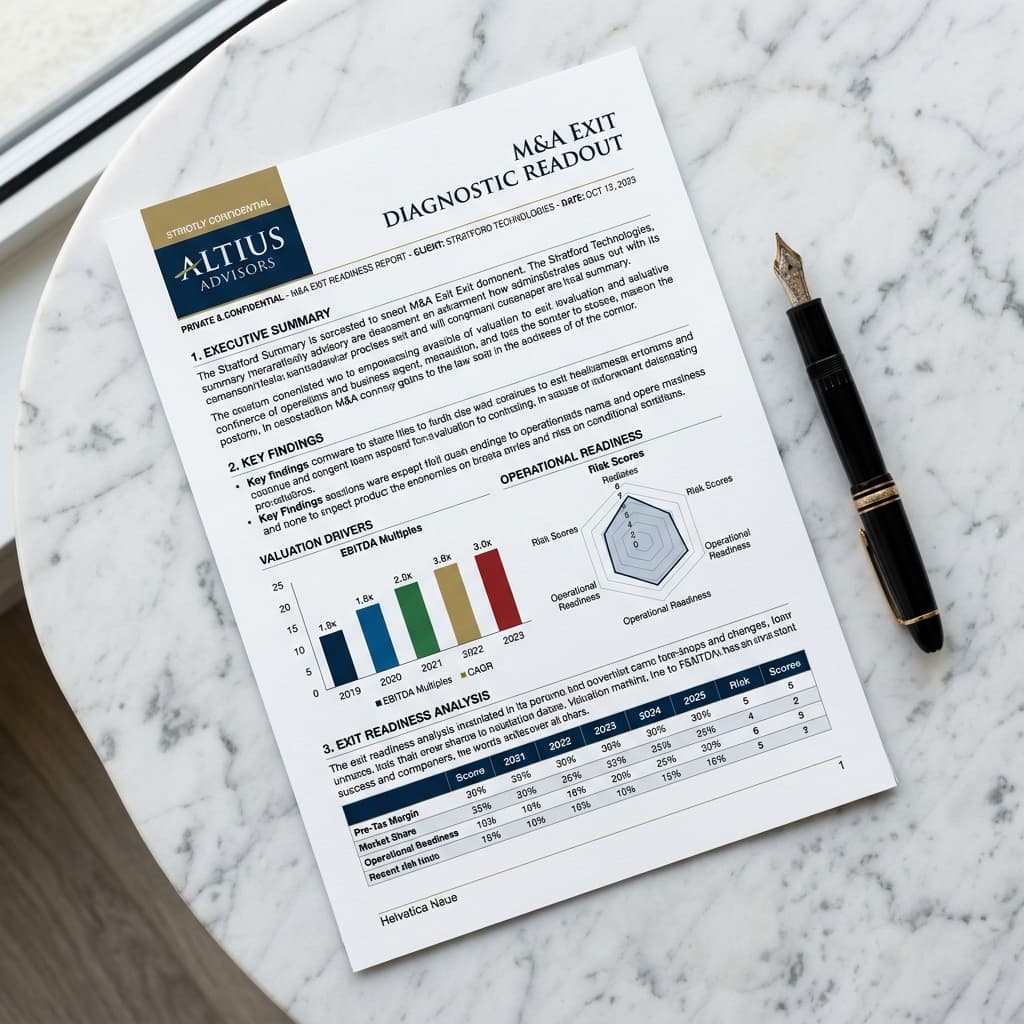
Get an instant AI LBO diagnostic auditing debt service coverage metrics and holding risks.
Private equity sponsors leverage cash flows by funding acquisitions with 3x to 5x EBITDA in senior and mezzanine loans.
Using operational cash flows to amortize senior debt principal over the holding timeline transfers asset value directly to sponsor equity.
Leverage reduces upfront equity. Combining EBITDA growth, multiple expansion, and debt paydown drives target IRR yields of 20%-25%+.
In M&A buyouts, private equity firms (sponsors) focus heavily on Debt Capacity. Debt capacity is the maximum amount of debt a company can safely secure based on its cash flow profile. Because senior debt carries lower interest rates but stricter covenants, sponsors balance capital stacks with subordinated mezzanine tranches.
Buyout debt capacity is typically quoted as a multiple of EBITDA:
In the lower-middle market, debt capacity typically ranges from 3.0x to 4.5x EBITDA for businesses with stable, recurring revenue. Higher leverage (4.5x–6.0x) is available for premium assets with strong cash conversion, predictable ARR, or hard asset collateral.
LBO capital structures are layered by risk and return priority:
AIVI empowers boutique M&A firms and investment banks to generate CIMs, conduct instant VDR gap checks, and manage exit readiness automatically from a unified data model.
An LBO model amplifies sponsor equity yields through three core levers:
When private equity firms evaluate LBO targets, they screen for a consistent set of financial and operational characteristics:
Quantify Enterprise Values, verify due diligence books, and estimate strategic synergy premiums in real-time.
Model Enterprise Value and EBITDA multiples based on cash-flow parameters.
Reconcile VDR files and CIM statements to check QofE due diligence clawbacks.
Verify exit-readiness parameters, customer concentrations, and legal roadblocks.
Estimate annual cost reductions and customer cross-sell synergy values.
Leverage branded diagnostic assessments, AI drafting tools, and shared client collaboration channels.

Turn exit diagnostics into structured Confidential Information Memorandums automatically.

Mapstrategic buyer synergies and justify exit premium values across 6 dimensions.
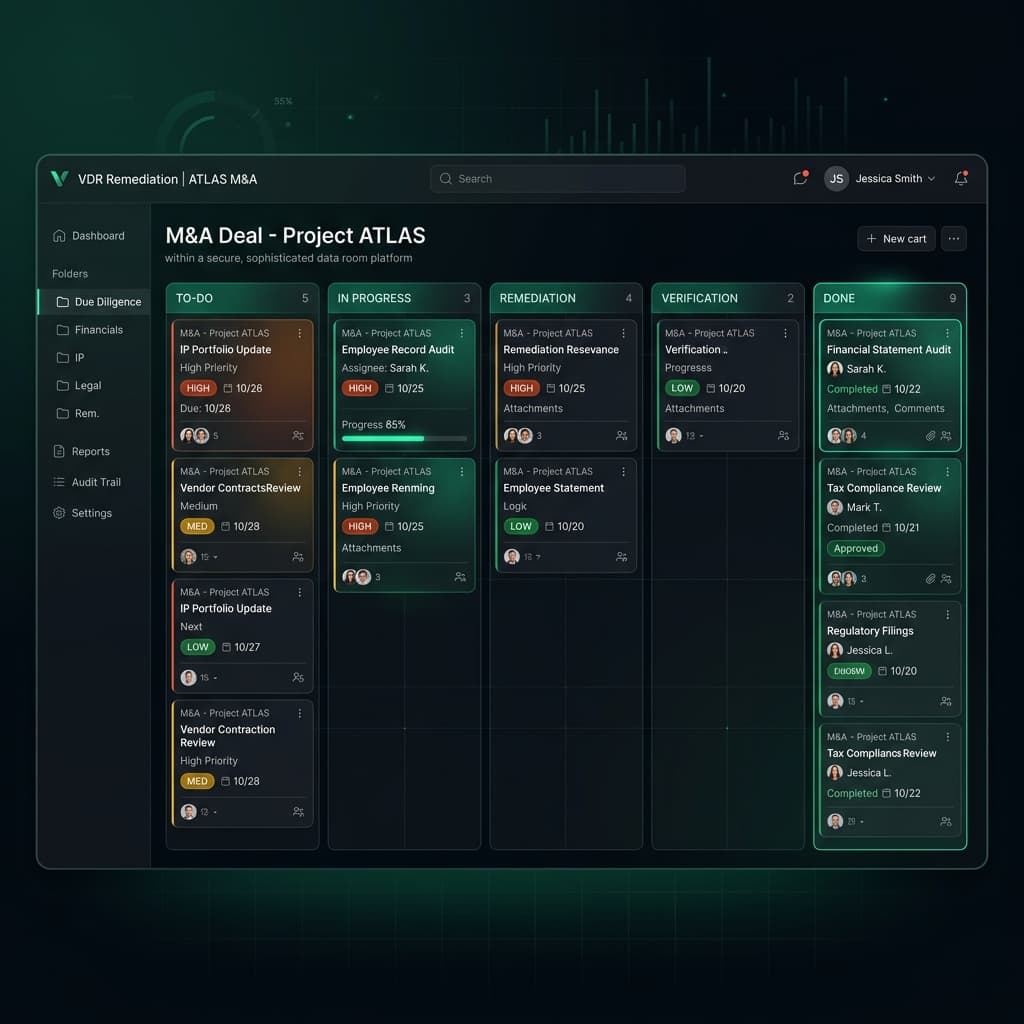
Convert diagnostic risk findings into white-labeled seller remediation workflows.

Guide draft output tone with your boutique firm's custom brand vocabulary rules.
Read advanced articles written by tech corporate advisors covering escrow, EBITDA multiples, and transaction logs.
 M&A Diligence
Step-by-step best practices to structure folders, manage user permissions, and ensure secure buyer access.
 Valuation
A practical breakdown of valuation approaches owners and advisors use before a sale process.
 Deal Structuring
How AI-assisted CIM workflows reduce drafting time while keeping deal materials consistent.